Touchline Analytics
30,478 shots across 1,170 matches, adjusted for opponent
- Shots tracked
- 30,478
- Matches
- 1,170
- Players
- 1,029
- Seasons
- 4
The problem
Raw expected goals treats a shot against a relegation side the same as one against the league leaders. Public xG tables inherit that flaw, so a club with an easy run of fixtures looks better than it is, and a striker feasting on promoted sides outranks one being marked out of games by Arsenal.
The approach
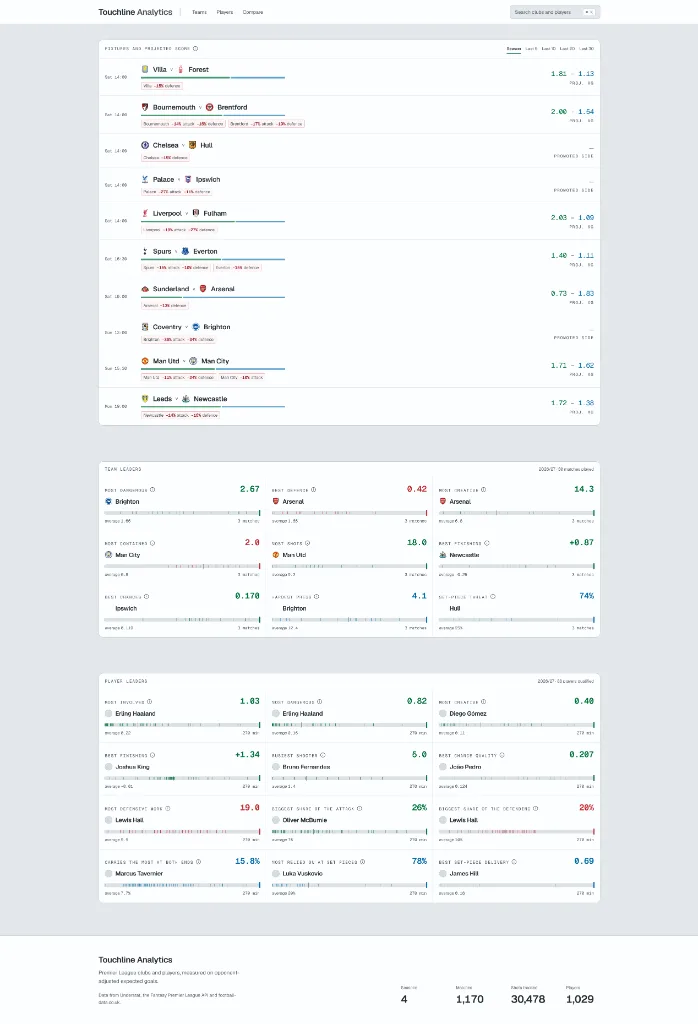
Adjust every shot for the strength of the opponent it was taken against, then roll the adjusted values up to player and club level. Each club carries an explicit attack and defence adjustment (Liverpool at -19% attack, -27% defence, for example) so the correction is visible rather than buried in a single composite rating. Data is pulled from Understat, the Fantasy Premier League API, and football-data.co.uk.
What I built
- Opponent-adjusted xG model over 30,478 shots from four Premier League seasons
- Per-fixture projected scorelines, with the model declining to project matches involving promoted sides rather than guessing without a top-flight baseline
- Nine club leaderboards and twelve player leaderboards, each shown against the league average rather than as a bare number
- Rolling sample windows (last 5, 10, 20, 30 matches, or full season) so form and long-run quality can be read separately
- Per-club and per-player pages, plus a head-to-head compare view for any two clubs
Stack
- Next.js
- React
- TypeScript
- Tailwind CSS
- Vercel